The Power of Colorful Marketing: Design That Connects
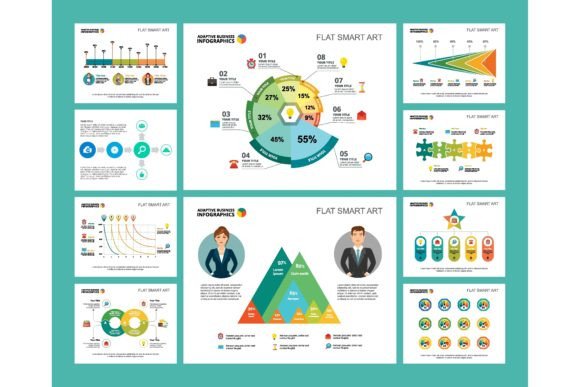
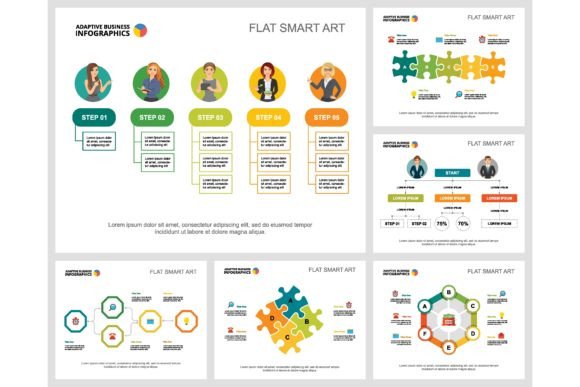
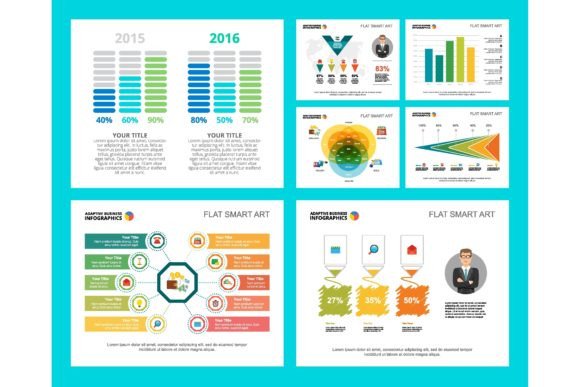
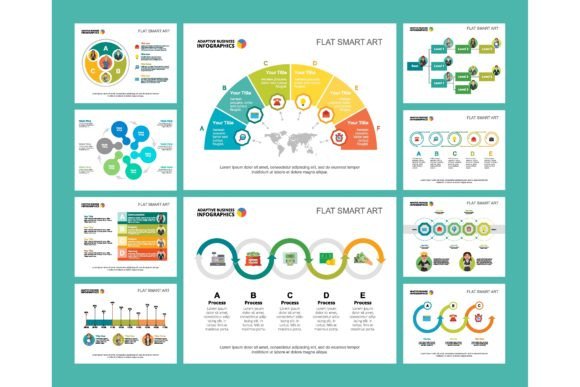
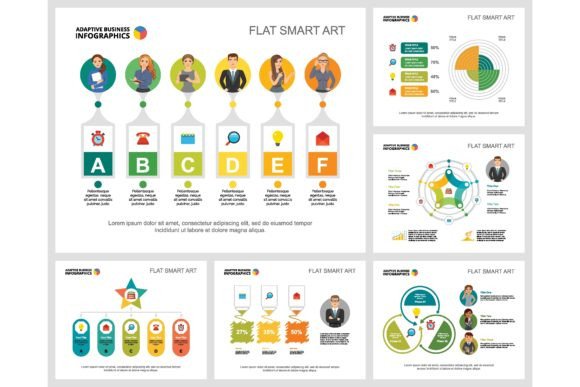
When people talk about marketing or insurance, they often think about complex numbers, dense reports, or dry policy language. Yet the most effective communication in these fields isn't gray—it’s vibrant. Colorful marketing isn't merely about making things look pretty; it's a strategic design concept that uses color psychology, clear visual hierarchy, and engaging graphic elements to transform complex information into compelling stories. This approach leverages infographic charts, bold business design elements, and thoughtful presentation templates to cut through noise and foster genuine understanding.
Beyond Decoration: Color as a Communication Tool
Think of the last financial report you saw. Was it a monolithic block of text? Or was it a document where key metrics popped out in a trusted blue, growth was highlighted in an optimistic green, and risks were cautiously noted in orange? That’s colorful marketing at work. It’s a visual system where every hue has a job. This concept moves away from the stereotype of insurance as staid or finance as impersonal. Instead, it builds a personality that is confident, clear, and approachable.
The overall appeal is its ability to humanize data. A workflow layout decorated only in black and white can feel mechanical. Introducing a coordinated color palette for different stages—a calming lavender for planning, a energetic yellow for execution, a solid navy for review—makes the process feel more dynamic and intuitive. For brochure design or a presentation slide template, these colors create visual landmarks, guiding the viewer’s eye and helping them retain information. The style is modern, clean, and purposeful, avoiding childish or chaotic rainbows. It’s professionalism, amplified.
Where This Visual Strategy Works Best
The applications are vast because the principle is universal: people respond to visual clarity. In branding and marketing, a company can use a distinctive color set across all assets to signal innovation in a traditional sector like insurance. A serif font for body text paired with bold, colorful infographic charts in a sans serif font creates a trustworthy yet forward-looking feel.
For digital and web design, colorful marketing is essential. Social media graphics thrive on quick visual comprehension. A well-designed chart set explaining coverage tiers or investment benefits, shared on LinkedIn or Instagram, performs far better than a text-only post. In print and publishing, annual reports, client newsletters, and educational brochures become documents people actually want to read. Editorial design for a financial blog can use color blocks to break up long articles, improving readability and engagement.
Even for personal projects and small businesses, this concept is a game-changer. A hobbyist selling crafts online can use a simple, colorful presentation template to create a polished product catalogue. A local entrepreneur can use a workflow layout infographic to explain their service process on their website, building client confidence. The tools are the same, scaled to the need.
Influencing Perception and Building Trust
How does introducing color actually change outcomes? First, it directly influences readability and visual hierarchy. Our brains process color before shape or text. Strategic color use immediately tells a viewer what’s most important, what’s related, and what’s a call to action. A dull, monochrome financial report forces the reader to do all the work of sorting information. A colorful one does half that work for them, reducing cognitive load and increasing retention.
This leads directly to brand perception. Consistency in using a defined color palette across a report, a slide deck, a brochure, and a website creates a cohesive brand identity. It signals attention to detail and systemic thinking. For an insurance firm or a financial advisor, this builds a subconscious association of reliability and modernity. It’s not just about recognition; it’s about positive recognition.
Finally, it drives audience engagement. People are visual creatures. A page filled with thoughtful design elements—a pie chart in contrasting but harmonious colors, a timeline with distinct phase colors, a key statistic icon in a bold accent color—is simply more interesting. It invites the viewer in. Engagement is the first step toward understanding, trust, and action.
Practical Guidance for Implementing Colorful Design
Adopting this concept doesn’t require being a master designer. It requires a shift in mindset. Start by evaluating project fit. Ask: Is my content complex or data-heavy? Would my audience benefit from visual guidance? Almost all financial, insurance, and process-oriented content answers yes.
Next, think in systems. Don’t pick colors randomly. Choose a primary color that aligns with your brand’s core message (e.g., blue for trust, green for growth). Then select a secondary palette of 3-4 colors for differentiation within charts and layouts. These should work harmoniously together. Many modern presentation slide templates and infographic chart sets offer pre-built, professional color schemes you can adopt.
Testing is crucial. View your design on different screens and in print if applicable. Ensure color contrasts are strong enough for readability, especially for text overlays on charts. Check that the colors don’t convey unintended emotions—for instance, using too much red in a financial report might inadvertently signal alarm.
Consider your font pairings as part of the color system. A clean, neutral sans serif font for body text often works best, letting the colors take the spotlight in headlines and graphics. If you’re using a more expressive display font for logos, ensure its color treatment aligns with the overall palette. The goal is a unified visual language.
Bringing Concepts to Life: Real-World Examples
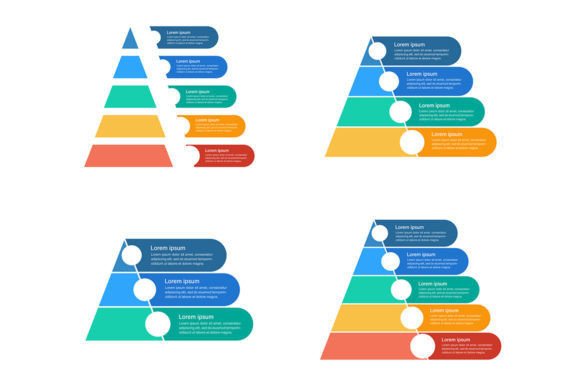
Imagine a local insurance agency creating a brochure for family coverage. Traditionally, it might be a list of policies. Using colorful marketing, they design a two-page layout. Page one has an infographic chart set illustrating “The Protection Pyramid,” with foundational coverage in a stable slate blue, health benefits in a reassuring teal, and specialty options in a soft gold. The visual hierarchy is immediate. Page two uses a workflow layout with icons to show the simple claim process, each step in a different shade of a calming green gradient. The brochure feels helpful, not salesy.
Or consider a freelance content creator producing a report on blog performance for a client. Instead of a spreadsheet, they use a presentation slide template designed for reports. Key metrics are highlighted in large, colored numerals. Growth trends are shown in line charts with an optimistic orange line. Audience demographics are a pie chart with distinct, friendly colors. The client receives not just data, but a story—a story they can easily understand and present to others.
The licensing for commercial design assets like premium chart sets or template packs is straightforward. Most are offered with commercial licenses that allow use in client work. Always review the license to ensure it fits your project scope, whether it’s for a single brochure or for ongoing brand identity work across multiple mediums.
Ultimately, colorful marketing and insurance concept design is about respect for your audience. It acknowledges that their time and attention are valuable. By transforming dense information into clear, engaging, and visually coherent experiences, you build stronger connections, convey messages more effectively, and elevate your work from mere communication to memorable conversation. The best design doesn’t shout; it guides. And often, it does so in brilliant color.