The Power of Color: Transforming Data and Training with Visual Design
In today's information-rich environment, simply having data or a training concept isn't enough. The challenge lies in communication—making complex information understandable, memorable, and actionable. This is where the strategic use of colorful statistics and vibrant training concept design becomes a critical business skill. Moving beyond basic bar graphs and bullet points, these design elements act as a visual language, bridging the gap between raw information and human insight.
Why Color Goes Beyond Decoration
Color is not merely an aesthetic choice; it's a functional tool. When applied to statistics and training materials, color serves several key purposes. It categorizes and groups related data points, making comparison intuitive. It establishes hierarchy, guiding the viewer's eye to the most important metrics or concepts first. It can evoke emotion and urgency—a red might highlight a critical area needing attention in a corporate report, while a calming blue could denote completed modules in a training concept overview. This functional application of color transforms a spreadsheet full of numbers into a coherent story.
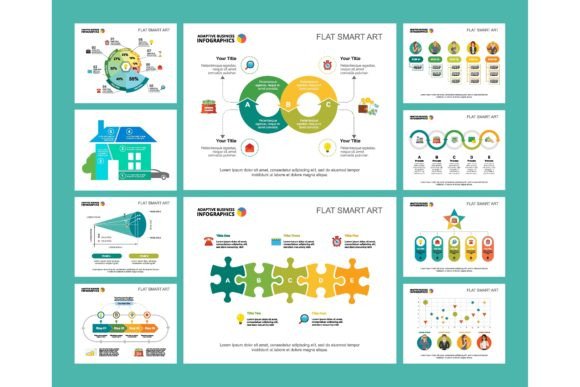
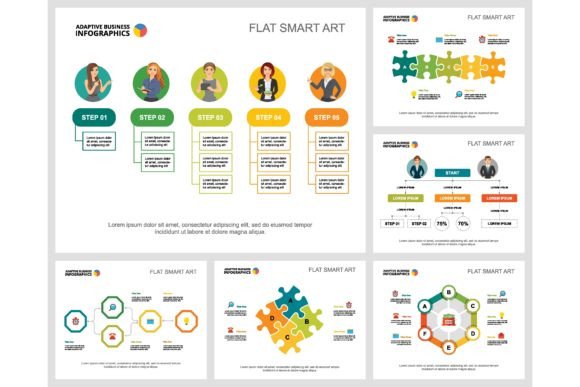
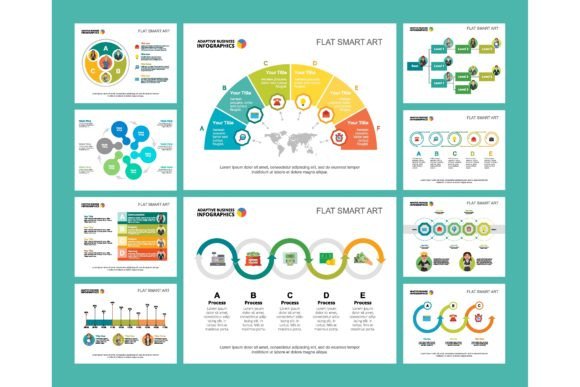
Consider a sales performance dashboard. Using a monochrome palette makes differentiation laborious. But applying a consistent, thoughtful color scheme—where each region is assigned a distinct hue—allows stakeholders to instantly grasp geographic performance trends. The colorful statistics become a map, not just a table. This principle is equally vital for training concepts. A complex multi-stage training process can be overwhelming in text, but a color-coded infographic chart delineating phases, prerequisites, and outcomes creates a clear mental model for learners.
Building a Visual Vocabulary for Your Business
The most effective use of colorful statistics and training concept visuals relies on consistency. This is about developing a visual vocabulary for your organization. Just as you have brand guidelines for logos and fonts, you should establish guidelines for data and training design. This ensures that a "status alert" is always represented by the same orange across every presentation slide template, corporate report, and leaflet layout. This consistency reduces cognitive load for your audience—they learn your visual language and can interpret new materials faster.
This vocabulary includes choices about color palettes (are you using bold, contrasting colors or a more subdued, gradient-based scheme?), chart types (when does a pie chart serve your purpose versus a stacked bar?), and iconography. For a training concept infographic, icons paired with color can powerfully symbolize different skills or knowledge domains, making the material accessible even before someone reads a word.
From Corporate Reports to Advertising: One Toolkit, Many Applications
The beauty of well-designed colorful statistics and training concept elements is their versatility across business mediums. The same core design principles and assets can be adapted to serve vastly different communication goals.
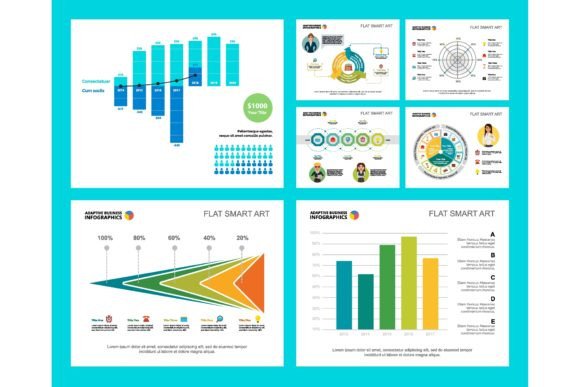
- Corporate Reports & Investor Briefings: Here, clarity and authority are paramount. Color is used strategically to highlight key financial trends, risk assessments, and growth metrics. The design is often clean and professional, using color to draw attention without being distracting. Infographic charts can summarize quarterly achievements, replacing pages of text with a single, impactful visual.
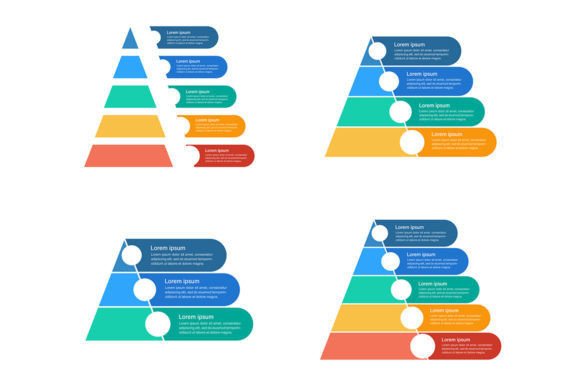
- Presentation Slide Templates: For live presentations, visuals must support the speaker and engage the audience. Dynamic colorful statistics that build or change can guide the narrative. Training concept slides benefit from a progressive color reveal, showing a path from beginner to expert. Good template design pre-defines these color animations, saving time and ensuring visual coherence.
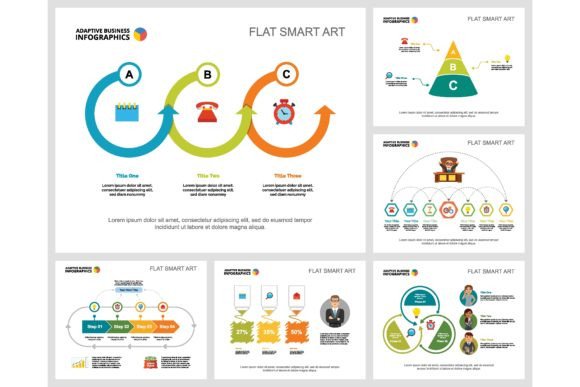
- Advertising & Leaflet Layouts: In these contexts, the goal is quick impact and persuasion. Colorful statistics here become bold and simplified—think of a poster claiming "80% Faster Results" with that percentage in a large, vibrant circle. Training concept visuals in advertising might showcase a colorful, step-by-step path to certification to attract potential course participants. The design is more emotive and marketing-focused.
- Internal Posters & Wall Graphics: Often overlooked, these static displays can continuously communicate core messages. A large poster in an office hallway with colorful statistics on safety incidents or project milestones keeps goals visible. A training concept mural illustrating the company's leadership development path serves as a constant reminder of growth opportunities.
The underlying training concept or data set remains the same, but the design execution is tailored to the medium's intent and audience attention span.
Practical Benefits You Can Measure
Adopting a strong visual design strategy for your information yields tangible benefits. Engagement increases significantly—people are more likely to read, remember, and discuss content that is visually appealing. Decision-making speed improves because insights are easier to extract from a well-designed chart than from a raw data dump. In training, comprehension and retention rates go up when complex concepts are broken down into color-coded segments. Furthermore, a consistent visual style across all materials—from the annual report to the training manual—strengthens brand identity and professionalism. It signals that your organization values clarity and thoughtful communication.
Key Considerations Before You Start Designing
While the advantages are clear, jumping into creating colorful statistics and training concept visuals requires some forethought. Here are common factors successful teams consider.
- Audience Analysis: Who is viewing this? Technical experts might tolerate more complex, multi-colored charts, while a general public audience needs simpler, high-contrast visuals. The color choices and complexity must match the viewer's literacy.
- Accessibility is Non-Negotiable: Color must not be the only way information is conveyed. Ensure there are text labels, patterns, or differences in value (light vs. dark) so that color-blind users can still interpret the statistics or training concept flow. This is a critical ethical and practical consideration.
- Tool Selection and Skill: Do you have the right software (like advanced charting in data tools or graphic design software) and the in-house skill to use it effectively? Sometimes, investing in template libraries or hiring a designer for core assets is more efficient than expecting every employee to become a design expert.
- Story Before Design: What is the core message or story the data or training concept is telling? Design should serve that story. Don't start by picking colors; start by defining the key insight or learning objective. The visual design is then crafted to illuminate that point.
- Balance Between Consistency and Freshness: While a visual vocabulary is important, materials can become stale if they always look identical. Allow for some thematic variation—perhaps using a different accent color palette for a new training initiative—while keeping core structural elements consistent.
By addressing these points, you move from ad-hoc, decorative coloring to a strategic, functional design system.
Integrating Colorful Design into Modern Workflows
Modern business tools make integrating these principles easier than ever. Data visualization platforms often allow for saved color themes that can be applied to all company reports. Presentation software supports master slide templates with pre-defined color schemes for different content types—one for financial updates, another for training concept introductions. Cloud-based design libraries enable marketing, training, and reporting teams to all pull from the same set of approved infographic chart elements, ensuring unity across departments.
The workflow begins with content creation (gathering the statistics or outlining the training concept), followed by visual structuring (deciding the hierarchy and story), and finally design execution using the established tools and templates. This process ensures the colorful output is both beautiful and purposeful, enhancing communication in every corporate report, advertisement, leaflet layout, and poster your organization produces.