How Colorful Data Visualization Transforms Insurance and Marketing
Imagine presenting a quarterly report on customer demographics. A page of black-and-white pie charts and bar graphs sits next to a vibrant, multi-colored infographic that uses iconography, varied shapes, and a cohesive palette to tell the same story. Which page gets more attention, sparks more discussion, and is more easily understood? The answer is obvious. This is the power of the colorful insurance or marketing concept. It’s not just about making slides look prettier; it’s a fundamental shift in how we communicate complex data, abstract ideas, and brand stories to audiences that are increasingly visual and time-pressed.
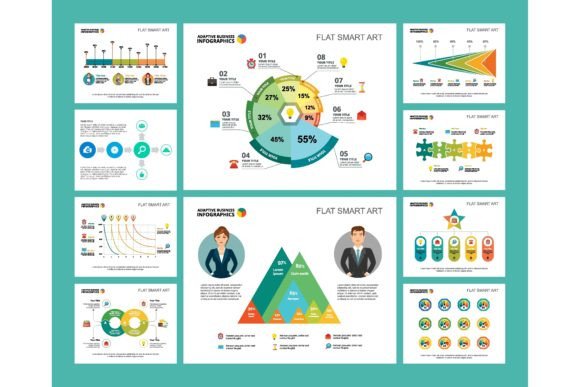
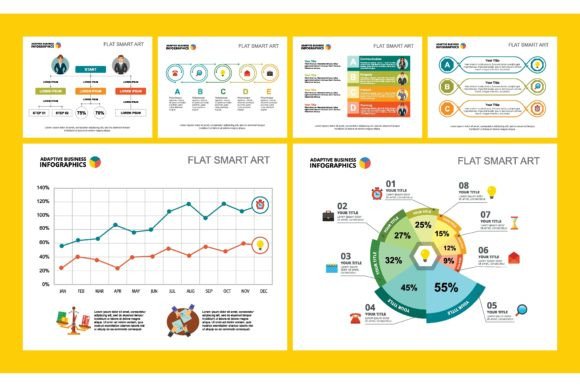
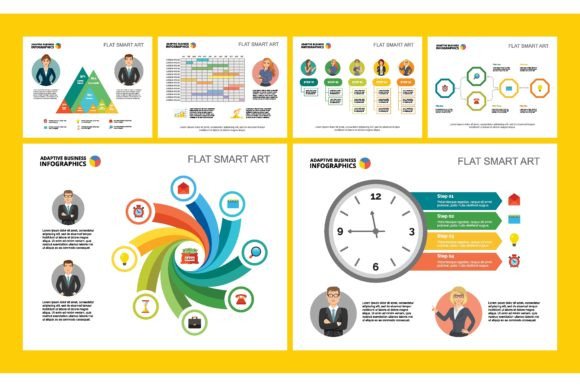
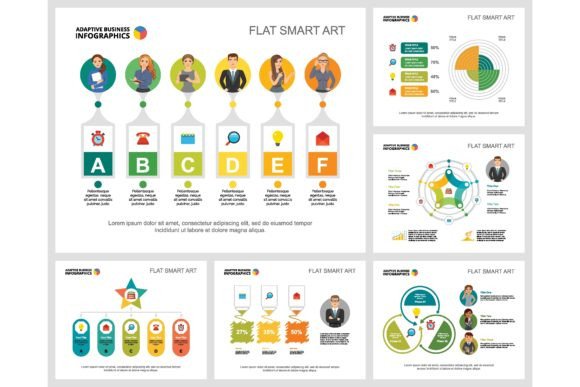
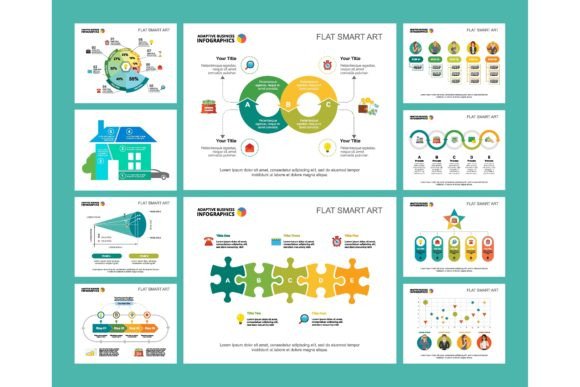
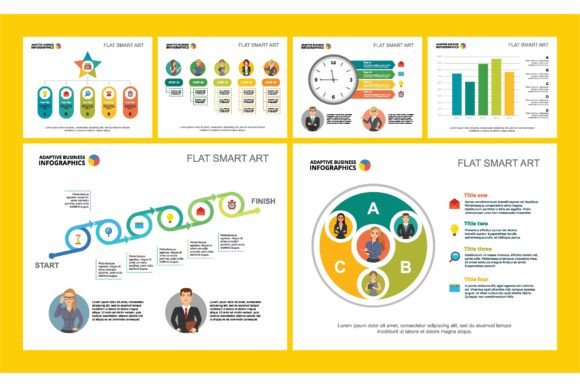
At its core, this concept is a design philosophy that leverages color psychology, structured visual hierarchy, and engaging graphic elements to make information not just visible, but memorable. It moves beyond the basic charts of spreadsheet software into a realm of designed communication. Think of a set of infographic charts where each segment of data is not only colored but paired with a relevant icon—a tiny house for homeowner policies, a car for auto insurance, a family silhouette for life insurance. The color scheme itself can convey meaning: calming blues for trustworthy financial security, energetic oranges for growth metrics in a marketing campaign, greens for positive environmental stats.
Where and Why This Approach Makes All the Difference
The use of colorful, well-designed infographics and presentation elements isn’t confined to a corporate boardroom. Its application is vast because the need to communicate effectively is universal.
For an insurance agent meeting with a young family, a colorful leaflet comparing different life insurance tiers becomes a conversation starter, not a confusing document. The parents can visually see the “protection coverage” block growing larger with each tier, colored in a reassuring deep blue, while the “investment growth” element shifts to a hopeful green. They’re not deciphering numbers; they’re understanding a story of security and future. This visual clarity builds trust and reduces the anxiety often associated with insurance products.
In a marketing team brainstorming a new campaign, a poster design template filled with colorful charts of market segmentation helps ideas flow. A demographic segment labeled “Urban Creatives” isn’t just text; it’s a purple segment with icons for a laptop, coffee cup, and headphones. This instantly aligns the team on who they’re targeting, making subsequent discussions about messaging channels and tone far more concrete. The colorful concept acts as a shared visual language, preventing misalignment and abstract debates.
Real-World Use Cases Across Different Roles
Freelancers and Small Business Owners: You’re creating a service package brochure or a one-page website to explain your offerings. A list of features is forgettable. A colorful, simple infographic that maps your process—from “Consultation” (yellow icon) to “Strategy” (orange icon) to “Delivery” (green icon)—visually guides a potential client through your value. It makes your complex service seem manageable and professional, elevating your materials from amateur to expert-level without a huge design budget.
Educators and Trainers: Explaining the intricacies of, say, digital marketing attribution or insurance risk models to students is challenging. A slide deck using a set of connected, colorful flowchart elements can show how clicks lead to conversions, or how risk factors pool together. Color coding different paths (organic traffic in green, paid traffic in blue) helps students follow and retain the information far better than a monochrome diagram. It turns a lecture into a visual experience.
Bloggers and Content Creators: When writing a deep-dive article on “Comparing Auto Insurance Providers,” embedding a colorful comparison chart within the post drastically increases its usefulness and shareability. Readers can quickly see which provider scores high on “Claims Processing” (a red-to-green scale) versus “Premium Cost” (a blue scale). This tangible, at-a-glance insight is what makes your content actionable and authoritative, encouraging readers to return and share.
Corporate Teams and Managers: The annual report or project proposal needs to justify budget and show results. A page of dense tables will be skipped. A section built with a colorful dashboard infographic—where key performance indicators are not just numbers but colored dials, progress bars, and trend lines—directs attention to successes and challenges. It allows senior executives to grasp the status in seconds and asks for more nuanced discussion where needed, making the entire document more impactful.
What to Consider Before Applying These Concepts
Jumping into colorful design without strategy can lead to clutter and confusion. The goal is clarity, not decoration.
First, consider your audience and context. A bold, vibrant palette with playful icons might be perfect for a startup’s marketing leaflet targeting millennials but could seem inappropriate for a conservative insurance firm’s annual report to shareholders. Align your color psychology and graphic style with your brand voice and the expectations of your viewer.
Second, think about data integrity. The design must serve the truth of the information. Avoid using colors that unintentionally imply ranking where none exists (like using “good” green for a neutral statistic). Ensure your visual scaling is accurate—a larger colorful shape should represent a larger number. The trust you build through visual appeal can be instantly broken if the underlying data is misrepresented.
Third, ponder accessibility. Not everyone perceives color the same way. Use contrasting colors and ensure that information isn’t conveyed by color alone. Pair colors with clear labels, icons, or patterns. This makes your colorful insurance or marketing concept materials inclusive and effective for a wider audience, including those with color vision deficiencies.
Finally, assess your tools and resources. You don’t need advanced graphic design software. Many presentation slide templates and online infographic generators now offer sophisticated, pre-built sets of colorful charts and business design elements. The key is choosing a template with a cohesive, professional system rather than mixing disparate styles, which can create a chaotic rather than compelling visual.
Connecting Design Features to Real Outcomes
When you see a template offering “color-coded flowcharts,” don’t just think “that’s a feature.” Think: “This will help my team visually trace the customer journey in our next campaign review, identifying the red-colored bottleneck stage instantly.” A “set of icon-based data points” translates to: “I can create a social media post that explains my insurance policy benefits in 15 seconds, using icons for medical, dental, and vision that people recognize before they even read.”
The outcome of adopting this colorful concept is more effective communication. It leads to meetings that are shorter and more decisive because everyone is aligned on the visual data. It creates marketing materials that convert better because they reduce cognitive load for the prospect. It builds reports that are actually read and remembered. It empowers educators, freelancers, and small business owners to compete with the visual communication standards of larger entities.
In a world saturated with information, the ability to make your message not only seen but understood and retained is a critical advantage. Whether you’re explaining the nuanced benefits of an insurance product, presenting marketing campaign results, designing a training module, or simply trying to make your next blog post more engaging, moving from plain data to a thoughtfully applied colorful insurance or marketing concept is one of the most practical upgrades you can make to your communication toolkit. It’s where clarity meets creativity to drive real results.