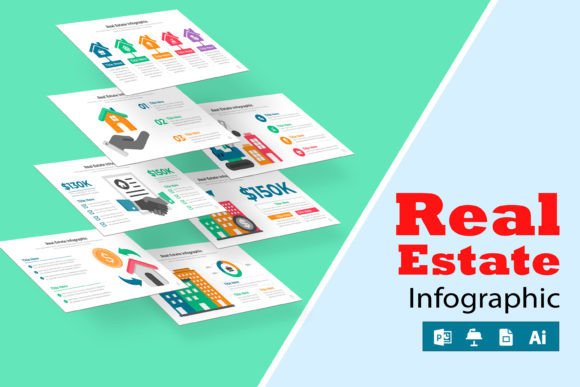
Real Estate Infographic Design Layout: A Tool for Visual Communication
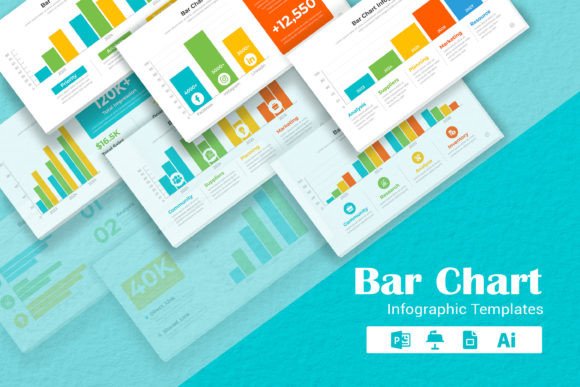
In an industry driven by numbers, trends, and location-specific details, presenting data clearly is a constant challenge for professionals. The traditional approach often involves lengthy reports, dense spreadsheets, or verbal explanations that can overwhelm clients. A Real Estate Infographic Design Layout offers a distinct alternative: a structured visual framework designed specifically to transform complex real estate information into an accessible, engaging, and professional graphic.
What Distinguishes a Real Estate Infographic Design Layout
A Real Estate Infographic Design Layout is not merely a generic template with real estate terms inserted. Its distinction lies in its foundational design being purpose-built for the industry’s unique data types. It anticipates the need to visually compare property features, market trends over time, demographic statistics, investment returns, or geographic distributions. Unlike a general graphic design tool, a layout tailored for real estate will inherently organize space for key metrics like price per square foot, occupancy rates, loan-to-value ratios, or comparative neighborhood amenities.
What makes it distinct is the integration of industry-contextual visual elements. A map section is not just a placeholder; it’s designed to highlight specific zones or parcels. Charts are pre-formatted to handle data like monthly rental yields or year-over-year appreciation. The layout’s structure guides the logical flow of information—perhaps from macro-market trends down to specific property details—ensuring the narrative is as clear as the visuals.
Comparing Approaches to Presenting Real Estate Data
When evaluating how to convey information, professionals typically consider several formats, each with its own strengths and tradeoffs.
Detailed written reports offer comprehensive depth and are essential for legal or formal documentation. However, for client presentations or marketing materials, they can be time-consuming to digest and may fail to highlight the most compelling points quickly.
Standard slide presentations (using basic PowerPoint or Google Slides templates) offer flexibility. Their strength is familiarity and ease of creation. The tradeoff is that without a deliberate design strategy, they can become a series of bullet-point lists and uncoordinated charts, lacking the cohesive visual impact of a single, well-composed infographic. A dedicated Real Estate Infographic Design Layout provides that cohesion, acting as a single, master visual that summarizes a full story.
Another alternative is custom graphic design, hiring a designer to create a unique infographic for each project. This can yield highly tailored and creative results. The limitations are clear: cost, time, and the need for effective communication between the professional and the designer to ensure accuracy. A pre-designed layout, especially one that is easy to edit, occupies a middle ground—offering a professional visual structure while retaining control and speed for the user.
Strengths and Practical Applications
The primary strength of a well-considered Real Estate Infographic Design Layout is its ability to facilitate understanding. It serves as a visual aid that can make comparative data immediate. For example, showing a side-by-side comparison of two investment properties using icon-based feature lists, bar charts for expense ratios, and small maps for location context allows a client to grasp advantages and tradeoffs in moments.
Its practical applications are broad. A real estate agent might use it to present a comprehensive neighborhood profile to a buyer, blending school ratings, transportation links, and recent sales data. A property manager could illustrate annual performance, showcasing maintenance costs, tenant retention rates, and revenue growth in one page. An investor or analyst might employ it to summarize the key findings of a market research report for partners.
The professional, clean design inherent in a good layout also conveys credibility. It signals that the presenter has organized and synthesized the information thoughtfully. This can be particularly powerful in competitive situations, such as pitching for a listing, appealing to sellers, or presenting to potential investment partners.
Understanding Tradeoffs and Limitations
While powerful for summarization and high-impact communication, a Real Estate Infographic Design Layout is not a substitute for all forms of data delivery. Its inherent limitation is depth. It is designed to highlight key points and trends, not to explore every nuance. For a client requiring exhaustive detail—such as a full due diligence report with hundreds of pages of disclosures—the infographic would serve only as a cover page or executive summary.
The utility of a template also depends heavily on its adaptability. A layout that is easy to edit in PowerPoint, Google Slides, or similar common software mitigates a significant tradeoff: the risk of a rigid design that cannot accommodate your specific data set. If the template forces awkward data fitting, its benefit diminishes. Therefore, evaluating the ease of customization—being able to change colors, chart types, text blocks, and icons—is a critical decision factor.
Another consideration is audience expectation. In some formal, institutional contexts, a traditional report format may be the required norm. The infographic might be an excellent internal tool for analysis or a supplemental client-facing piece, but not the primary document.
When It Is the Right Fit
A Real Estate Infographic Design Layout is likely the right choice when your primary goal is efficient communication and persuasion. Situations that call for it include:
- Client presentations where time is limited and you need to make a strong, quick impression.
- Marketing materials, such as property listings, investment offerings, or service brochures, where visual appeal drives engagement.
- Internal strategy meetings where you need to quickly align a team on market conditions or portfolio performance.
- Educational contexts, such as explaining market principles to new investors or clients.
When Another Option Might Be Needed
You may require a different approach or complementary tools when:
- The data is highly technical, regulatory, or legally binding, demanding the precision and thoroughness of a formal written document.
- The audience explicitly expects and relies on standardized, non-graphic formats (like certain institutional investors or government bodies).
- You lack the time or design confidence to properly adapt a template, and the outcome would look unprofessional—in which case, a simpler list of well-organized slides might be safer.
- Your data is so unique or complex that no pre-existing layout logically fits, pointing you toward custom design or a different visualization tool.
Key Factors for Decision Making
If you are considering utilizing a Real Estate Infographic Design Layout, focusing on a few practical factors can guide your evaluation.
First, assess the editability of the layout. Can you manipulate it without advanced design skills? Does it work in software you already use? Templates that offer flexibility in common programs reduce the barrier to effective use.
Second, consider its comprehensiveness. Does the layout structure have logical sections for the types of data you most frequently present—market stats, property comparisons, financial projections? A template with a "one-size-fits-all" approach may not serve your niche.
Third, think about integration. How will this infographic fit into your existing workflow? Will it be a standalone page, or will you incorporate it into a larger presentation? Its value increases if it seamlessly complements your current processes rather than requiring a wholly new approach.
Ultimately, the choice hinges on your specific communication needs. A Real Estate Infographic Design Layout is a powerful tool for synthesis and visual storytelling within the industry. It excels in making comparative data clear, presenting professional credibility, and saving time for both the presenter and the audience. By understanding its distinct role, strengths alongside its limitations, and the practical factors for implementation, you can make an informed decision on whether such a layout aligns with your objectives for presenting real estate data.