Beyond Green: Colorful Analysis and the Ecology Concept
The Ecology Concept has become a dominant theme in modern business, moving beyond simple environmentalism to represent a holistic approach to interconnected systems, sustainability, and growth. When paired with Colorful Analysis, this idea transforms from a monochrome obligation into a vibrant, actionable strategy. Colorful Analysis and Ecology Concept isn't just a set of charts; it's a visual and intellectual framework for making complex, systemic relationships understandable, engaging, and persuasive.
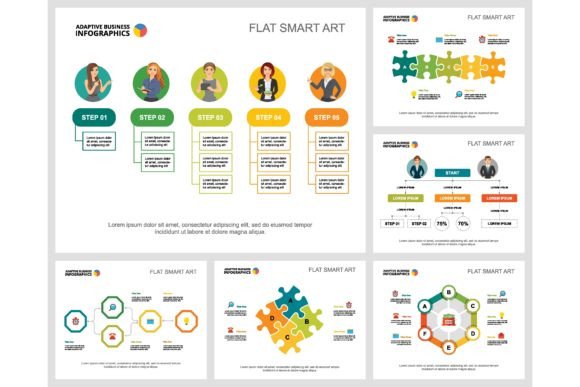
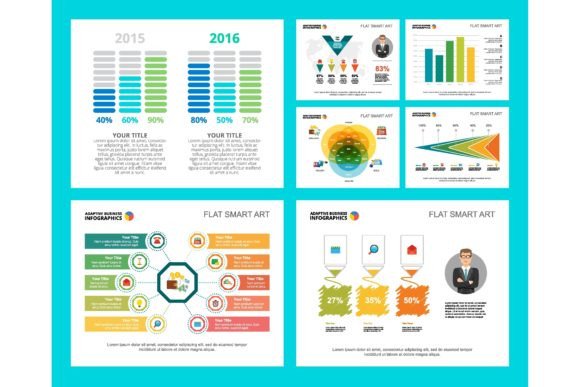
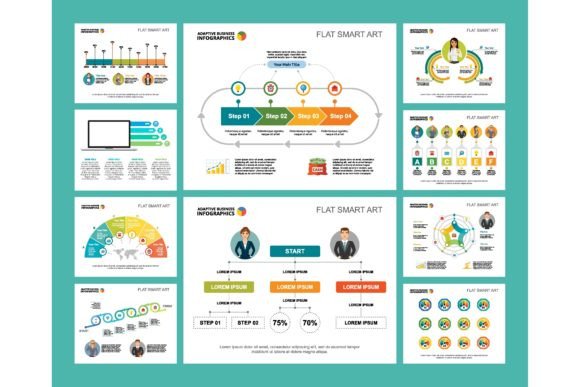
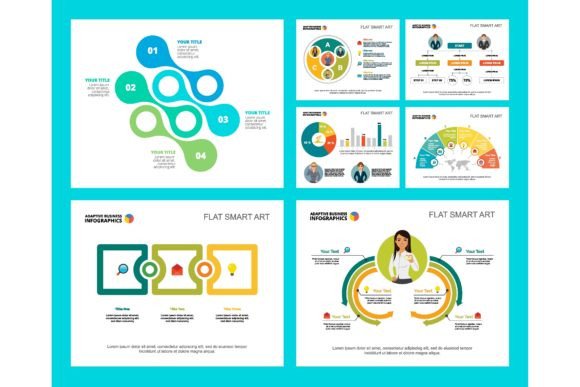
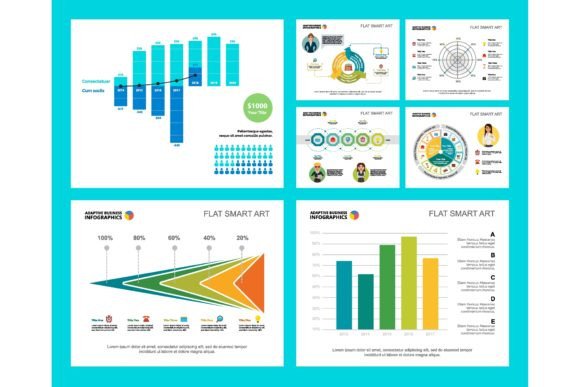
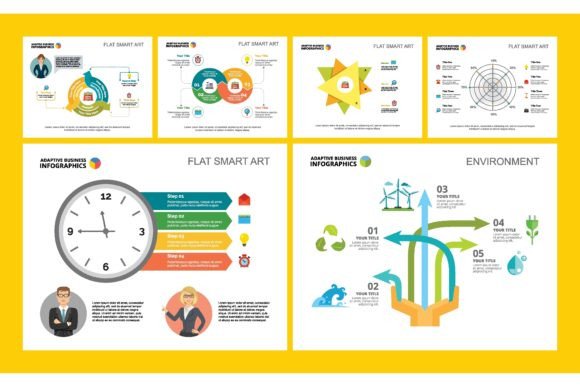
At its core, Colorful Analysis uses deliberate color psychology and clear visual hierarchy to break down information. An ecology concept infographic might use shades of blue to illustrate water cycles within a supply chain, warm oranges and yellows for energy flows, and deep greens for natural resource dependencies. This approach does more than beautify data—it encodes meaning, guides the viewer's eye, and creates an immediate emotional and intellectual connection to the subject matter. For a corporate report, this means clarity. For an advertising campaign, it means memorability. For a leaflet or poster, it means stopping power.
Why This Fusion Matters to Different Audiences
The value of this combined approach shifts dramatically depending on who is looking at it and what they aim to achieve. A marketer and a scientist may both need to communicate sustainability, but their priorities, tools, and end goals are worlds apart.
For Creators, Designers, and Freelancers
This is primarily a toolkit for communication and problem-solving. Their priority is creativity and flexibility. A freelance designer tasked with a client’s sustainability poster isn’t just selling a product; they’re telling a story of a company’s environmental journey. Using a Colorful Analysis approach, they might create a chart where each branch of a “business tree” uses a different color palette to represent departments (R&D, manufacturing, logistics), showing how each contributes to the overall corporate ecosystem. The ecology concept provides the narrative structure; color provides the emotional and logical cues. Their evaluation focuses on how adaptable the visual concepts are to different media—from a slide template to a large-format banner—and how quickly they can deploy these ideas to meet client deadlines.
For Professionals, Analysts, and Corporate Teams
Here, the emphasis is on precision, presentation, and commercial value. A financial analyst embedding an ecology concept into an annual report needs to show investors how environmental risks and opportunities are integrated into the company’s financial health. A colorful, layered infographic chart set can illustrate this interdependency far more effectively than a block of text. They might use a gradient—from red (high risk) to green (strong opportunity)—across a map of global operations. The priority is reliability of the data visualization and its ability to convey complex analysis in a boardroom-ready format. The “colorful” aspect is not decorative; it’s a functional part of the analytical language.
For Educators, Bloggers, and Publishers
This audience seeks learning value and engagement. An educator explaining a local ecosystem to students can use the same principles. A simple, colorful chart showing the flow of nutrients (represented by a flowing yellow line), predator-prey relationships (red and blue interconnected circles), and human impact (gray overlays) makes abstract biology tangible. The ecology concept provides the factual framework; color provides the mnemonic hooks that help students remember the relationships. Bloggers writing about sustainable living can use these visual metaphors to break down topics like home energy ecosystems or the circular economy of consumer goods, making their content more accessible and shareable.
Practical Applications Across Projects
How does this translate into real-world use? Consider a small business owner crafting a leaflet for a new eco-friendly product. A standard leaflet might list features. A leaflet built on Colorful Analysis and Ecology Concept would visually map the product’s lifecycle: from sustainable sourcing (green earthy tones), to low-energy manufacturing (cool blues), to compostable disposal (rich browns). This tells a deeper story about the product’s place in a wider system, appealing to a consumer’s values beyond the item itself.
For a marketer in charge of an advertising campaign, these templates offer a way to visualize brand ecology. How do customer service, product quality, community engagement, and environmental policy interact to create the brand’s health? A colorful, interconnected chart in an ad can succinctly communicate this holistic identity, setting the brand apart in a crowded market.
For Beginners and Hobbyists
If you're new to design or sustainability topics, the combined concept is a gateway to understanding. Your priority is ease of use and learning. Pre-designed infographic chart sets that utilize this philosophy offer a starting point. You don’t need to be a graphic designer to appreciate how color coding a personal budget as an “financial ecosystem” (with inflows as blue streams, outflows as red branches, and savings as a growing green canopy) can provide a fresh perspective. It helps you visualize personal finance as a dynamic system rather than a static list. Beginners should look for resources that explain the color choices and ecological metaphors clearly, allowing them to adopt and customize the ideas without advanced expertise.
Aligning the Concept with Your Goals
Evaluating whether Colorful Analysis and Ecology Concept is right for your needs comes down to your project’s core requirement. Are you trying to explain, persuade, or analyze?
If your goal is to explain a complex system—whether to students, clients, or the public—this framework is immensely powerful. The ecology concept provides the logical skeleton, and color provides the intuitive flesh. If your goal is to persuade, such as in advertising or a corporate reputation report, the emotional resonance of color combined with the credible structure of an ecological model is a potent combination. If your primary goal is internal analysis, the visual distinction afforded by color can help teams spot patterns, dependencies, and outliers in data more rapidly than monochrome charts.
Consider also your medium. This approach thrives in visual formats: presentation slides where you need to hold attention, report layouts where dense information needs breathing room, and poster designs where the message must be grasped from a distance. It may be less critical for a purely textual internal memo.
Ultimately, Colorful Analysis and Ecology Concept infographic tools are more than just business design elements. They represent a mindset. They ask us to see our work, our data, our businesses, and our messages as living, interconnected systems. By using color strategically to illuminate those connections, we don't just make our presentations prettier; we make our ideas clearer, our stories richer, and our impact more profound. Whether you are a CEO presenting a sustainability roadmap, a teacher illustrating a scientific cycle, or a consumer trying to understand a brand’s true environmental footprint, this fusion of color and concept makes the invisible relationships visible and the complicated beautifully simple.